Interpreting Federal Reserve Policy Through the Eras: A FRED Data Analysis
A data-driven look at how U.S. monetary policy has evolved across Fed chairmanships, from Volcker's disinflation to Powell's pandemic-era policy, using FRED economic data.
 Christopher A. Rotunno 4 min read
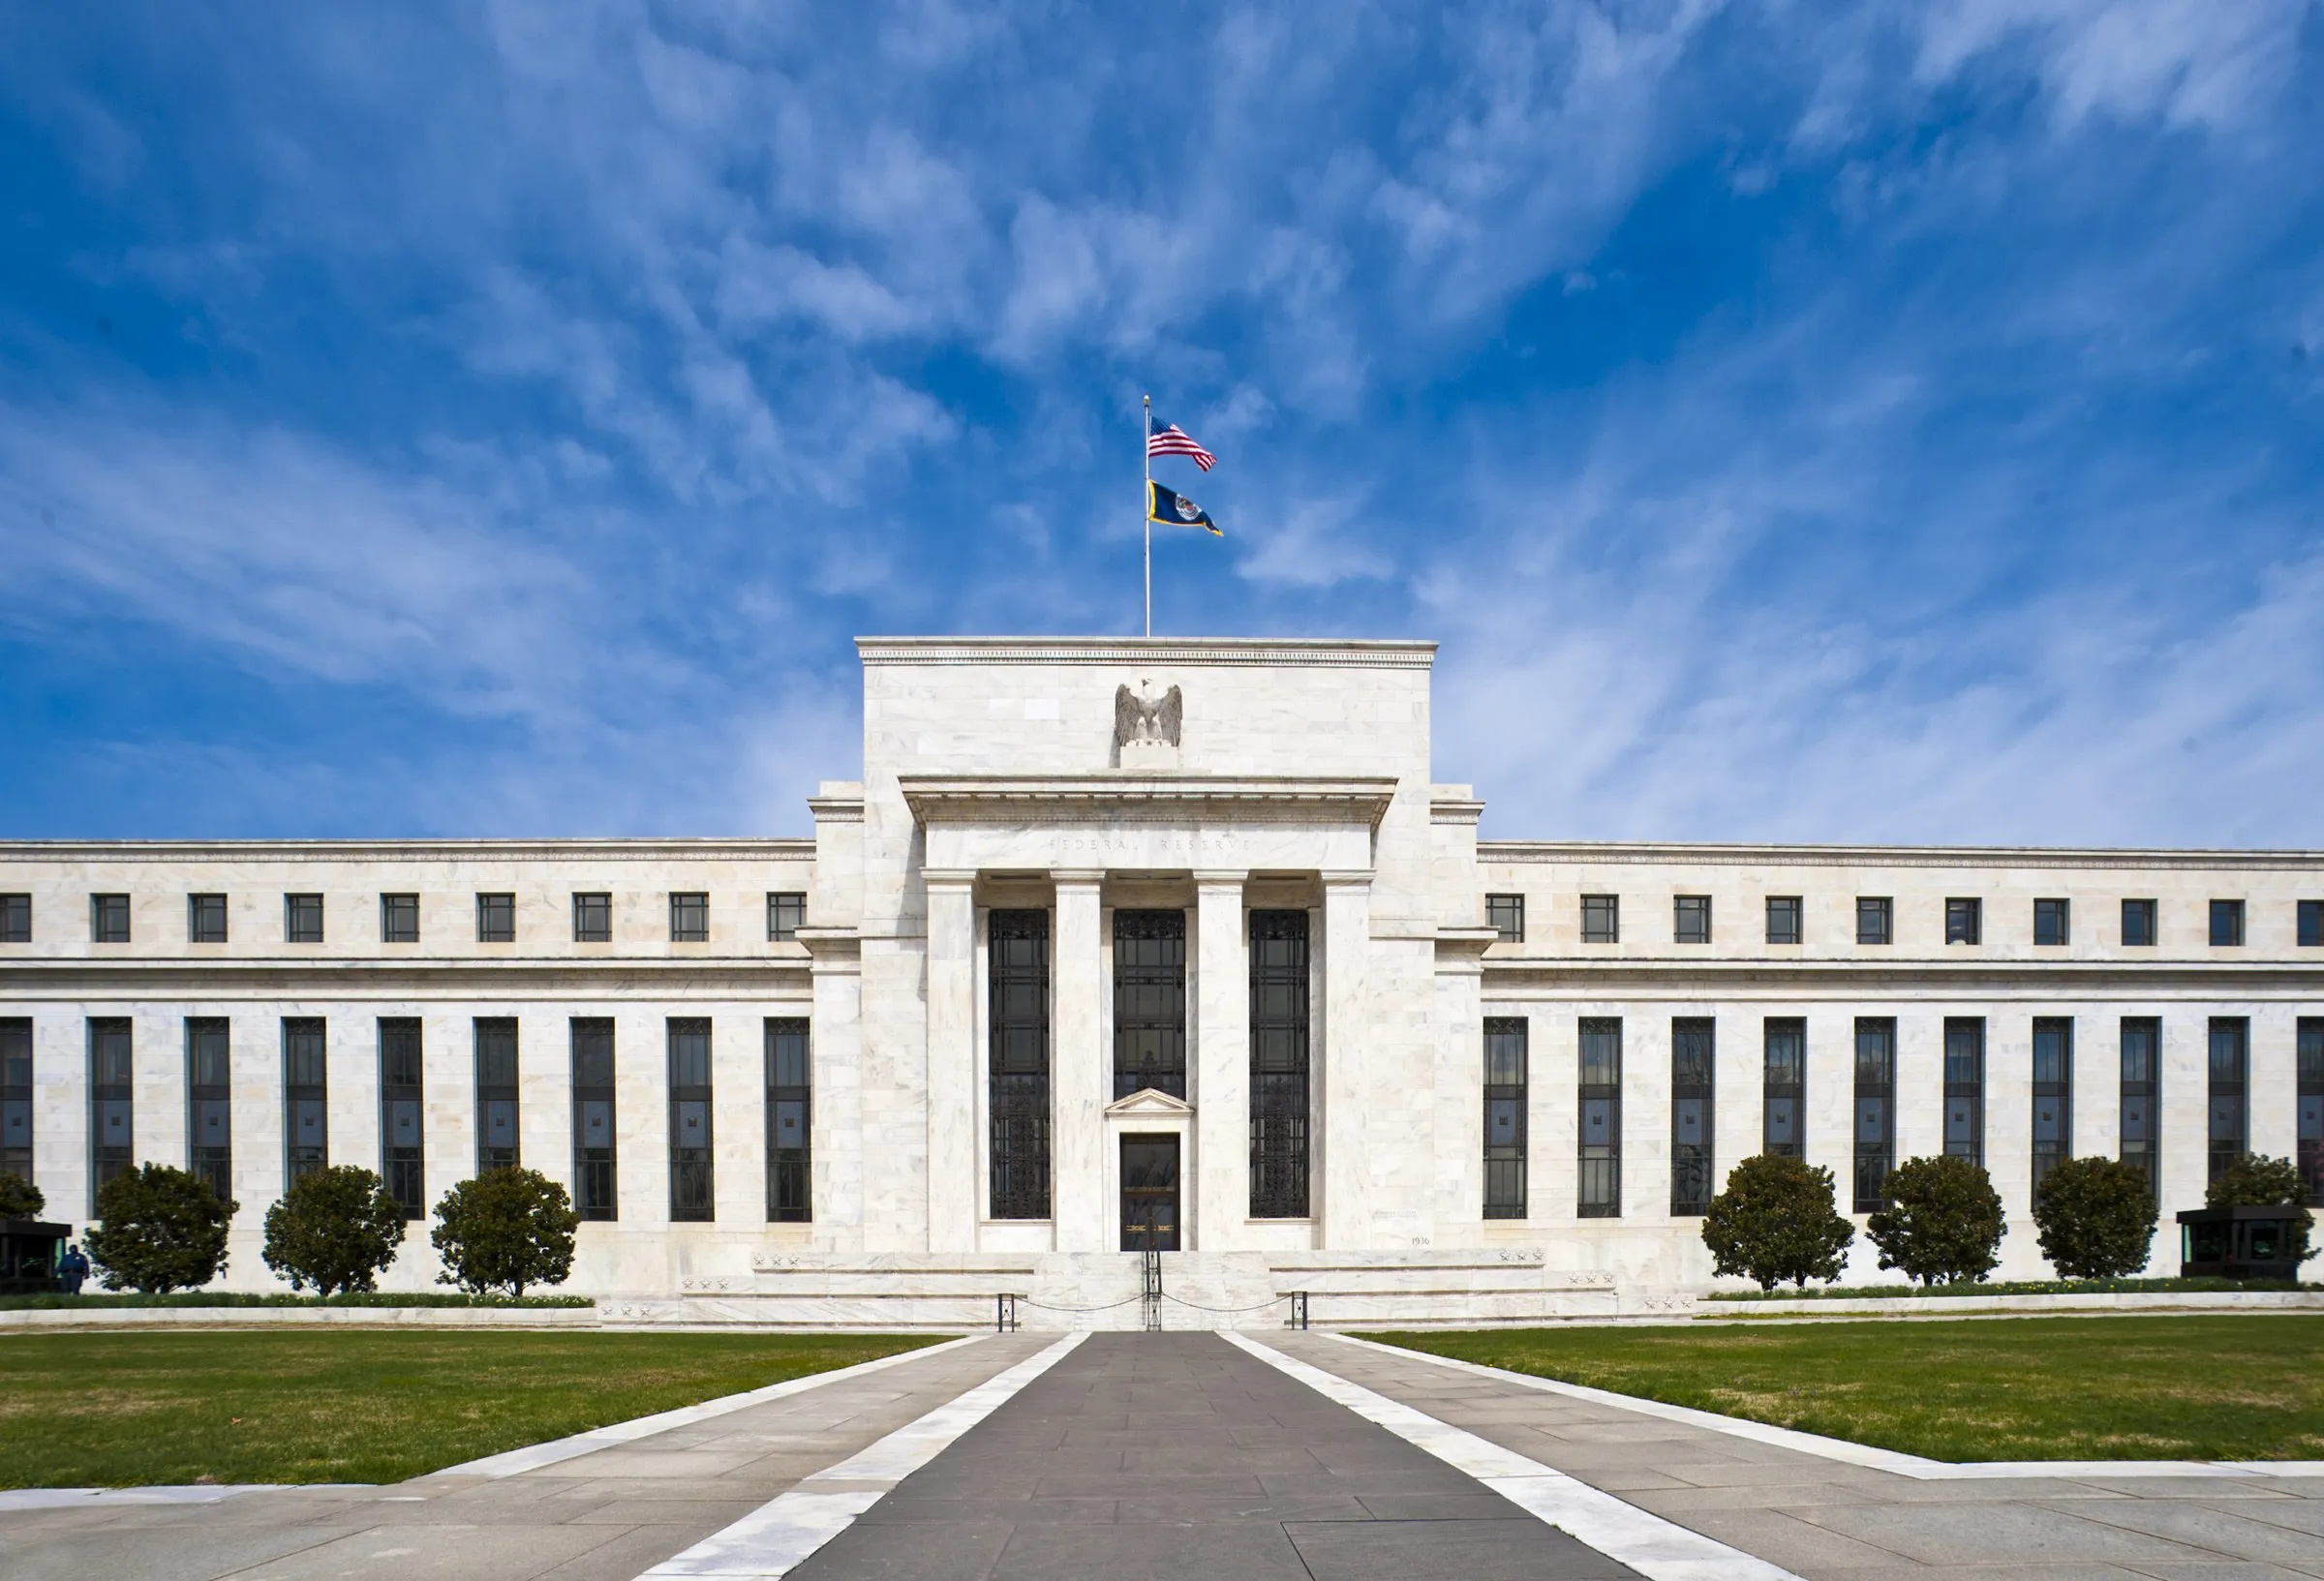
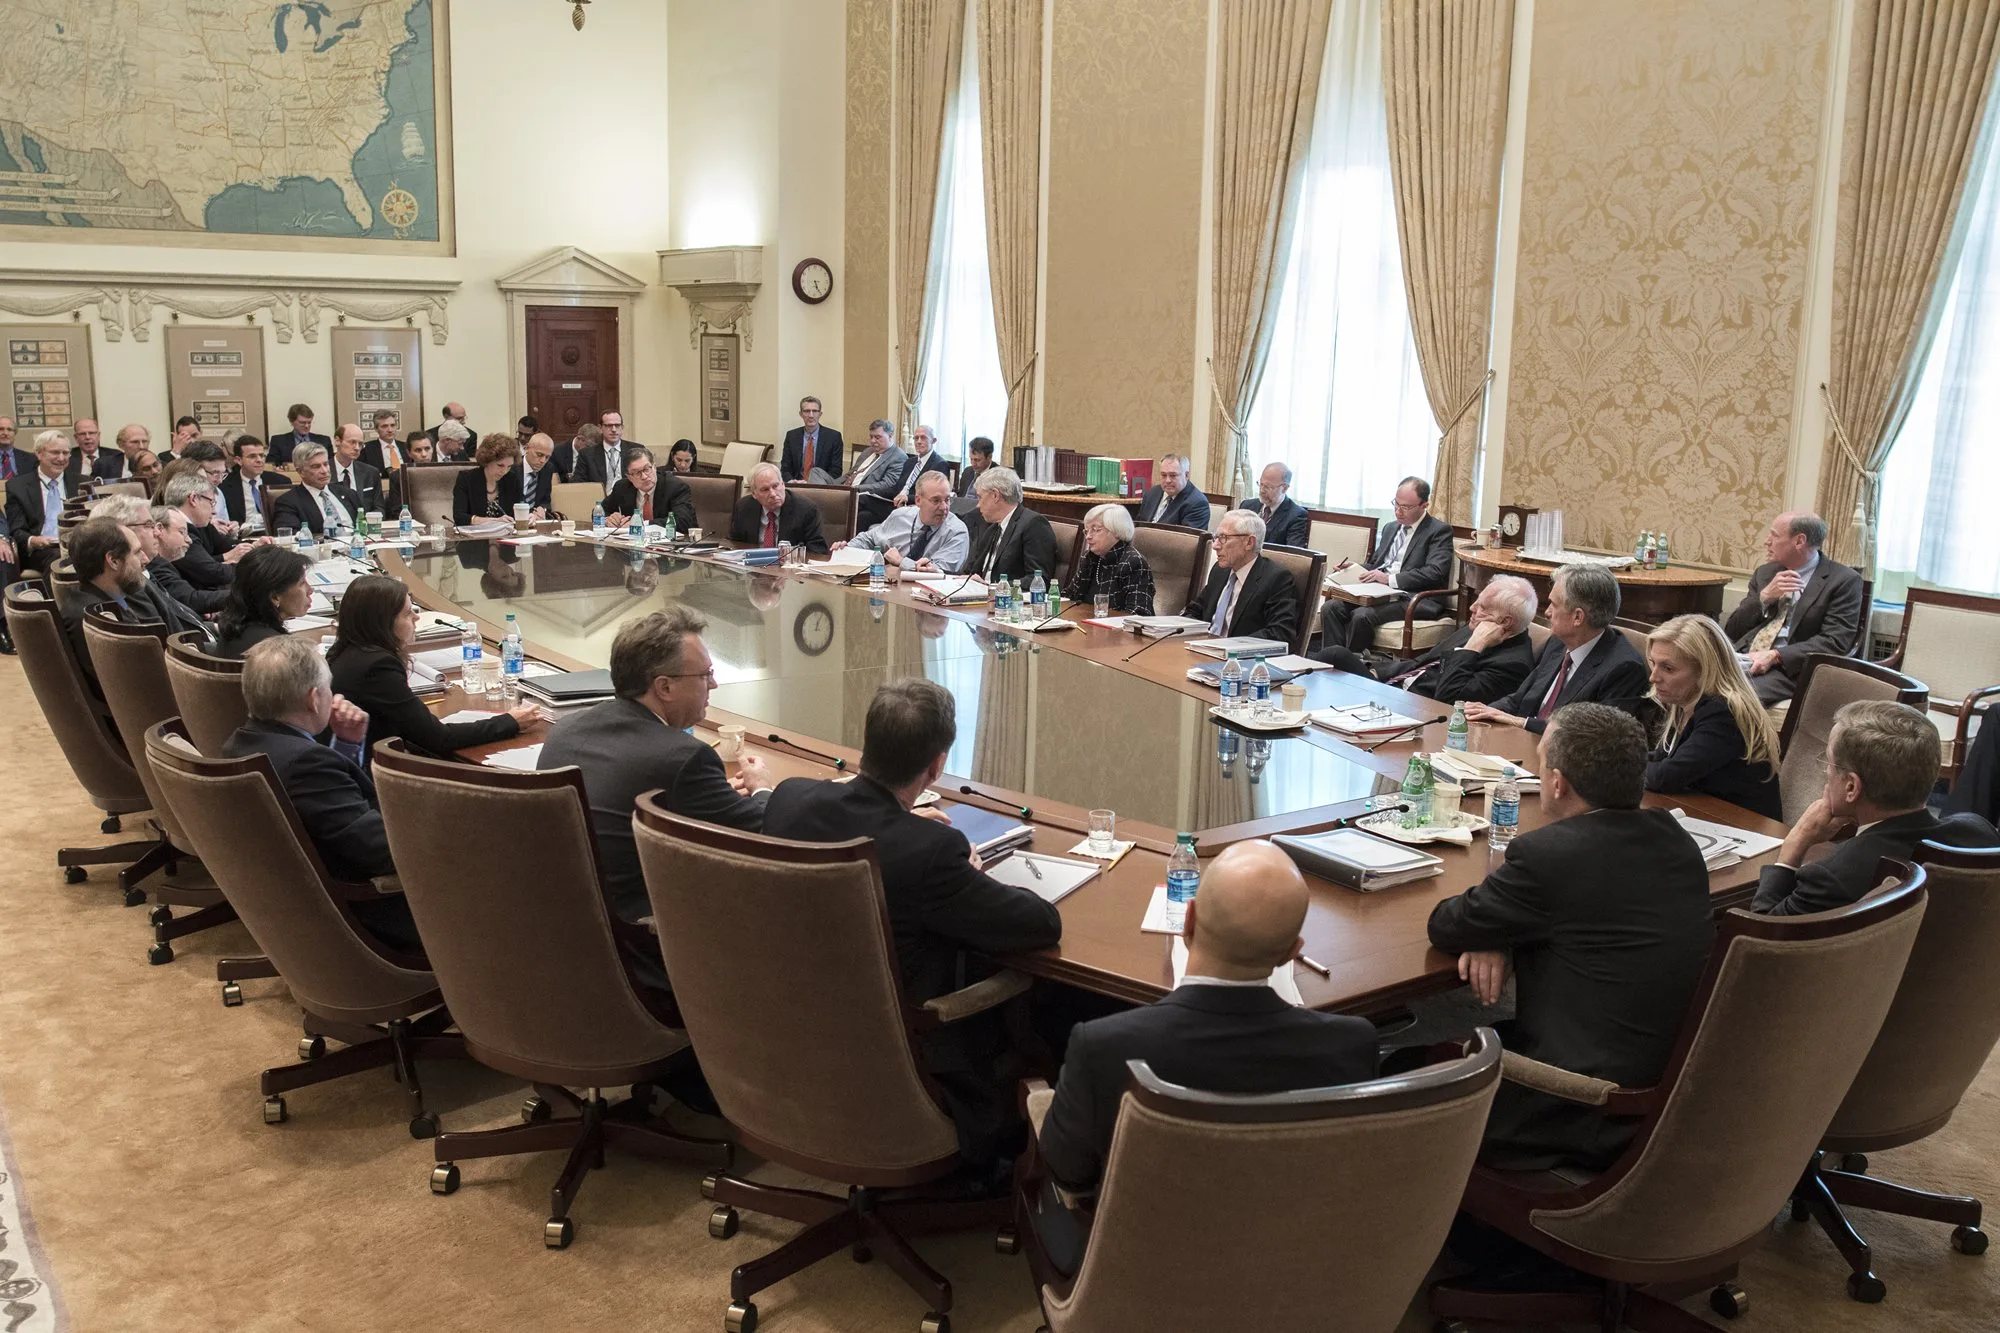
Photo: Federalreserve / Public domain / Wikimedia Commons
Federal Reserve decisions respond to conditions: inflation, unemployment, geopolitical shocks, and financial stress. Viewed across decades of data, those responses also form distinct eras, shaped by the economic circumstances and policy frameworks of each Fed chair’s tenure.
Using the FRED (Federal Reserve Economic Data) database, this analysis examines the federal funds rate across five chairmanships.
The Chairs and Their Contexts
Paul Volcker (1979–1987): Disinflation
Volcker took office with inflation rising sharply; it peaked at 14.8% in 1980. The Fed raised the federal funds rate to nearly 20% in 1981, and unemployment rose above 10% during the 1981–82 recession.
Inflation fell to under 4% by 1983. Many economists cite the episode as evidence of the value of central bank credibility, while others emphasize the high cost of the back-to-back recessions of 1980 and 1981–82.
Key FRED signal: A sharp inverted V in the Funds Rate from 1979–1983, followed by a gradual descent. Unemployment and inflation moved in opposite directions, consistent with a short-run Phillips curve tradeoff.
Alan Greenspan (1987–2006): The Long Expansion
Greenspan’s tenure included what was then the longest economic expansion in U.S. history, during the 1990s. His approach generally favored incremental adjustments.
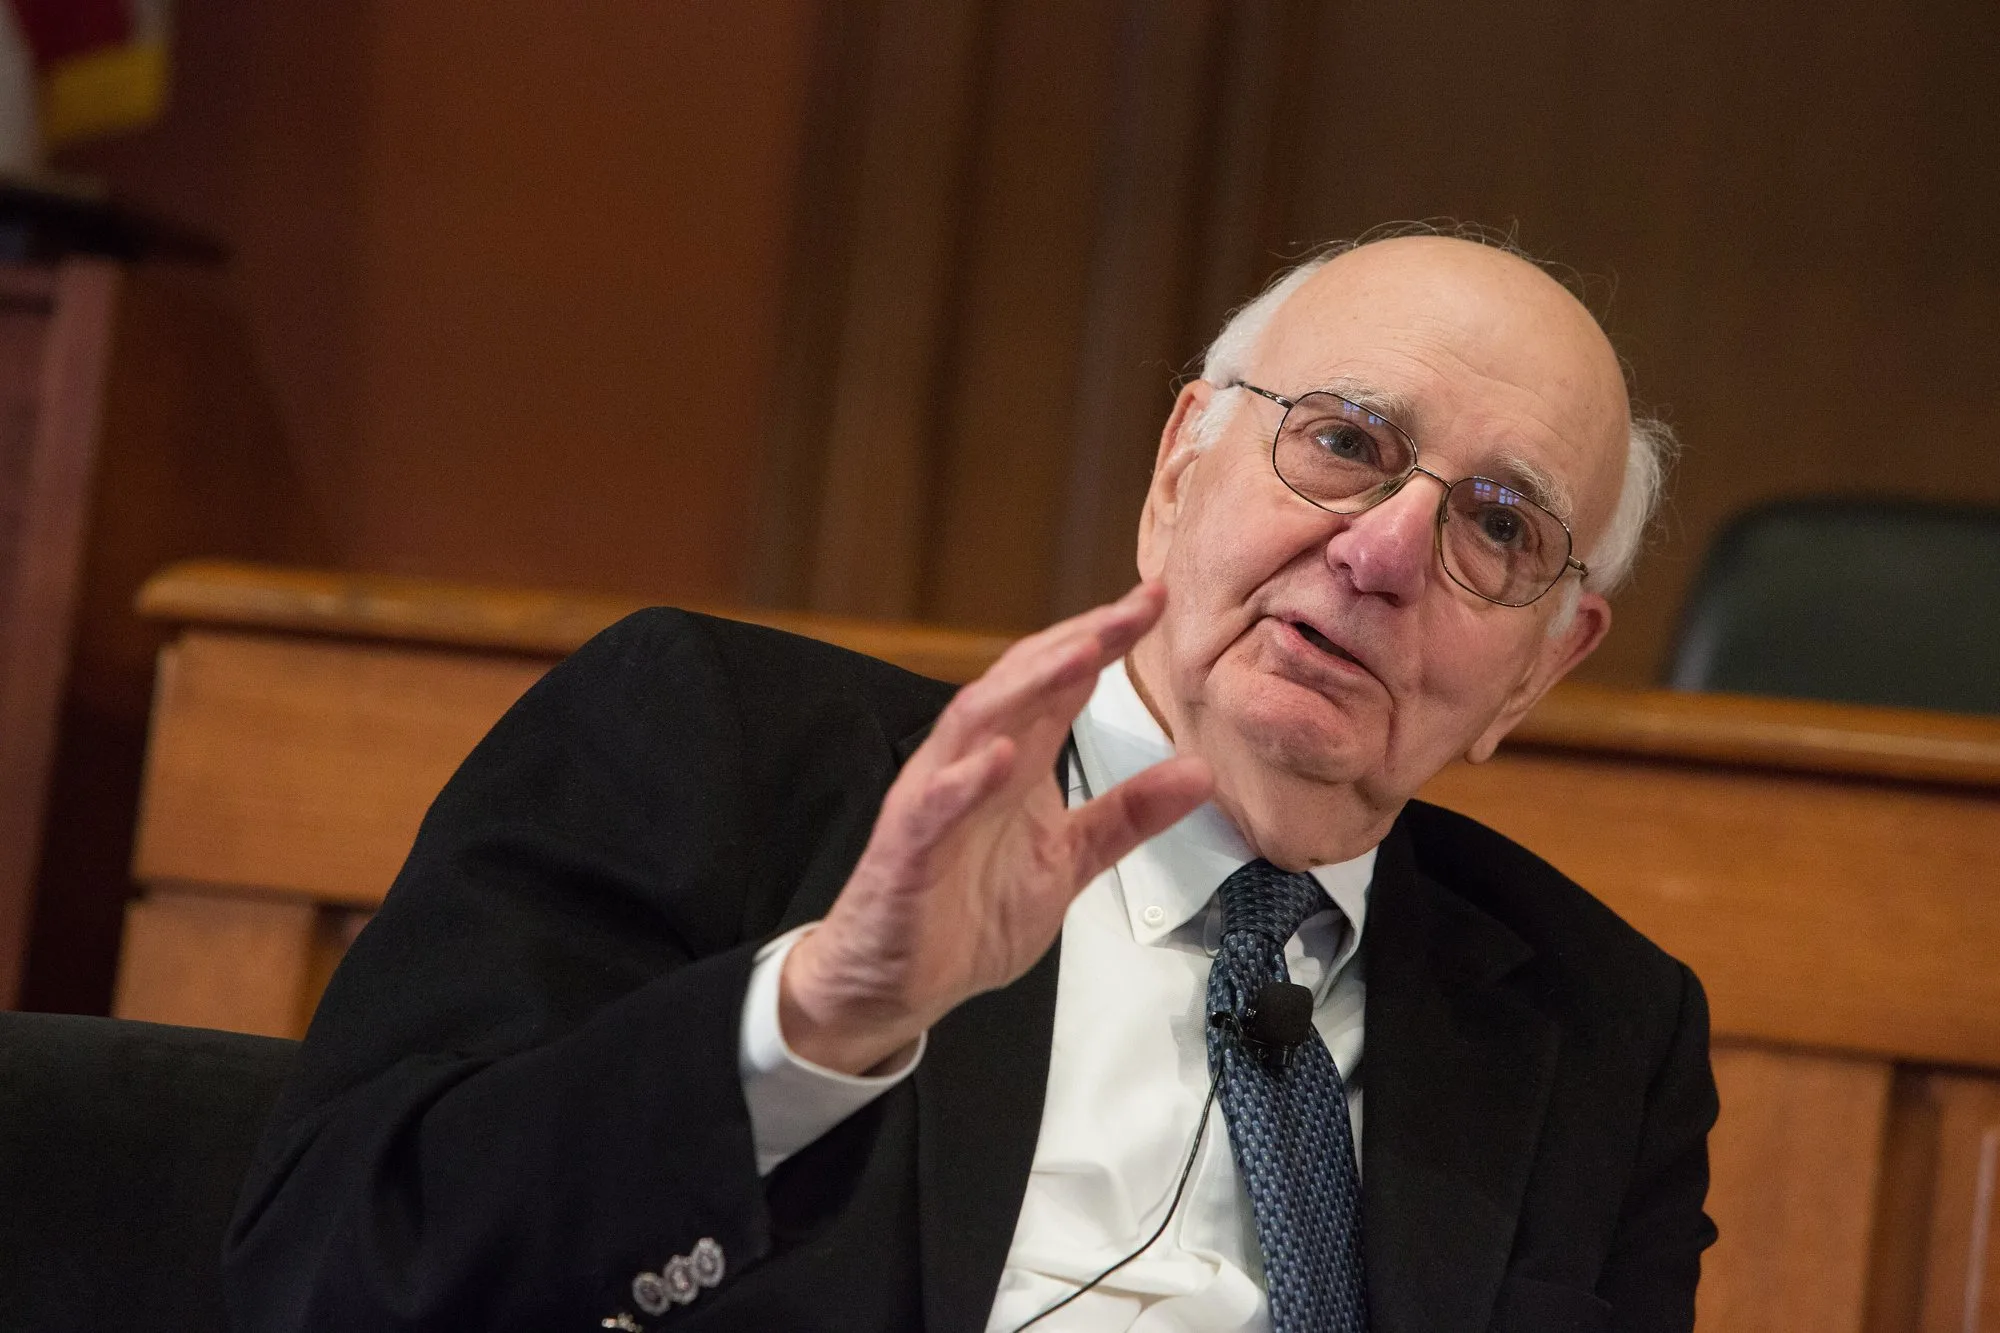
The 1994–95 rate cycle is often cited as an example of a soft landing: the Fed raised rates seven times in about a year, then eased, and the expansion continued. Critics later argued that the extended period of low rates after the dot-com bust (2001–2004) contributed to the housing bubble; Greenspan and others disputed how large that role was.
Key FRED signal: Smooth, oscillating rate cycles correlating closely with GDP growth — a “soft landing” template repeated across the 1990s.
Ben Bernanke (2006–2014): The Financial Crisis
Bernanke’s academic research had focused on the Great Depression. During the 2008 financial crisis, the Fed cut rates to near zero and launched large-scale quantitative easing (QE), purchasing assets to support financial conditions once the policy rate reached the zero lower bound. The Bank of Japan had used a form of QE earlier, in the 2000s.
The Fed’s balance sheet grew from ~$900 billion in 2008 to over $4.5 trillion by 2015.
Key FRED signal: The Funds Rate drops to 0–0.25% in December 2008 and stays there for seven years. This was unprecedented in modern Fed history and changed what monetary accommodation looked like.
Janet Yellen (2014–2018): Normalization
Yellen’s tenure centered on the question of when to raise rates after years at zero. The first hike came in December 2015, about nine years after the previous one.
The Fed under Yellen emphasized gradual moves and extensive communication. Unemployment fell to about 4.1% by the end of her term while inflation stayed below the 2% target, which led many economists to revisit estimates of how low unemployment could go without raising inflation.
Key FRED signal: A gradual staircase pattern in the funds rate from 2015 to 2018, alongside low unemployment and below-target inflation.
Jerome Powell (from 2018): Pandemic and Inflation
Powell’s tenure has included some of the largest rate swings in decades:
- 2018–2019: A hiking cycle, followed by three cuts in 2019 amid slowing growth and market stress
- 2020: Emergency cuts to near zero in response to COVID-19, along with a large expansion of QE
- 2022–2023: The fastest tightening cycle since the early 1980s, 525 basis points in about 16 months, after inflation reached 9.1%
Many forecasters expected the 2022–2023 hikes to cause a recession. Through 2024, unemployment remained low and inflation declined toward the 2% target, though economists continue to debate how much credit belongs to monetary policy versus easing supply constraints.
Key FRED signal: A near-vertical spike in the Funds Rate from 0.25% in March 2022 to 5.5% by July 2023. The trajectory resembles Volcker’s, but the underlying economy looks nothing like 1981.
What the Data Actually Shows
Pulling the effective Federal Funds Rate from FRED and overlaying CPI, unemployment, and GDP data reveals a few durable patterns:
Rate cycles are asymmetric. In this period, cuts were generally faster and deeper than hikes, reflecting quicker responses to downturns than to overheating.
The baseline shifted over time. Estimates of the neutral interest rate declined over several decades. Whether that trend reversed after 2022 is an open question among economists.
The zero lower bound changed the toolkit. Once the policy rate reaches zero, conventional tools are limited, and since 2008 asset purchases have become a standard part of the Fed’s options.
Inflation expectations play a central role. A key lesson often drawn from the Volcker era is the importance of keeping inflation expectations anchored. Market-based expectations can be tracked in FRED through breakeven inflation rates derived from TIPS.
Pulling the Data Yourself
FRED makes this analysis accessible to anyone. Key series to start with:
| Series ID | Description |
|---|---|
FEDFUNDS | Effective Federal Funds Rate |
CPIAUCSL | Consumer Price Index (Urban, All Items) |
UNRATE | Unemployment Rate |
GDPC1 | Real GDP |
T10YIE | 10-Year Breakeven Inflation Rate |
You can query these directly via the FRED API or pull them into Python using the fredapi library:
from fredapi import Fred
fred = Fred(api_key='your_key_here')

fedfunds = fred.get_series('FEDFUNDS', observation_start='1975-01-01')
cpi = fred.get_series('CPIAUCSL', observation_start='1975-01-01')
From there, plotting rate cycles against inflation and unemployment provides useful historical context alongside the Fed’s own statements and projections.
The Takeaway
Monetary policy can look straightforward in hindsight. In real time, each Fed chair worked with imperfect data, political pressure, and competing economic theories. FRED data makes it possible to examine the record directly: rate levels, timing, duration, and outcomes.
The eras are distinct, and understanding them provides useful context for interpreting future policy cycles.
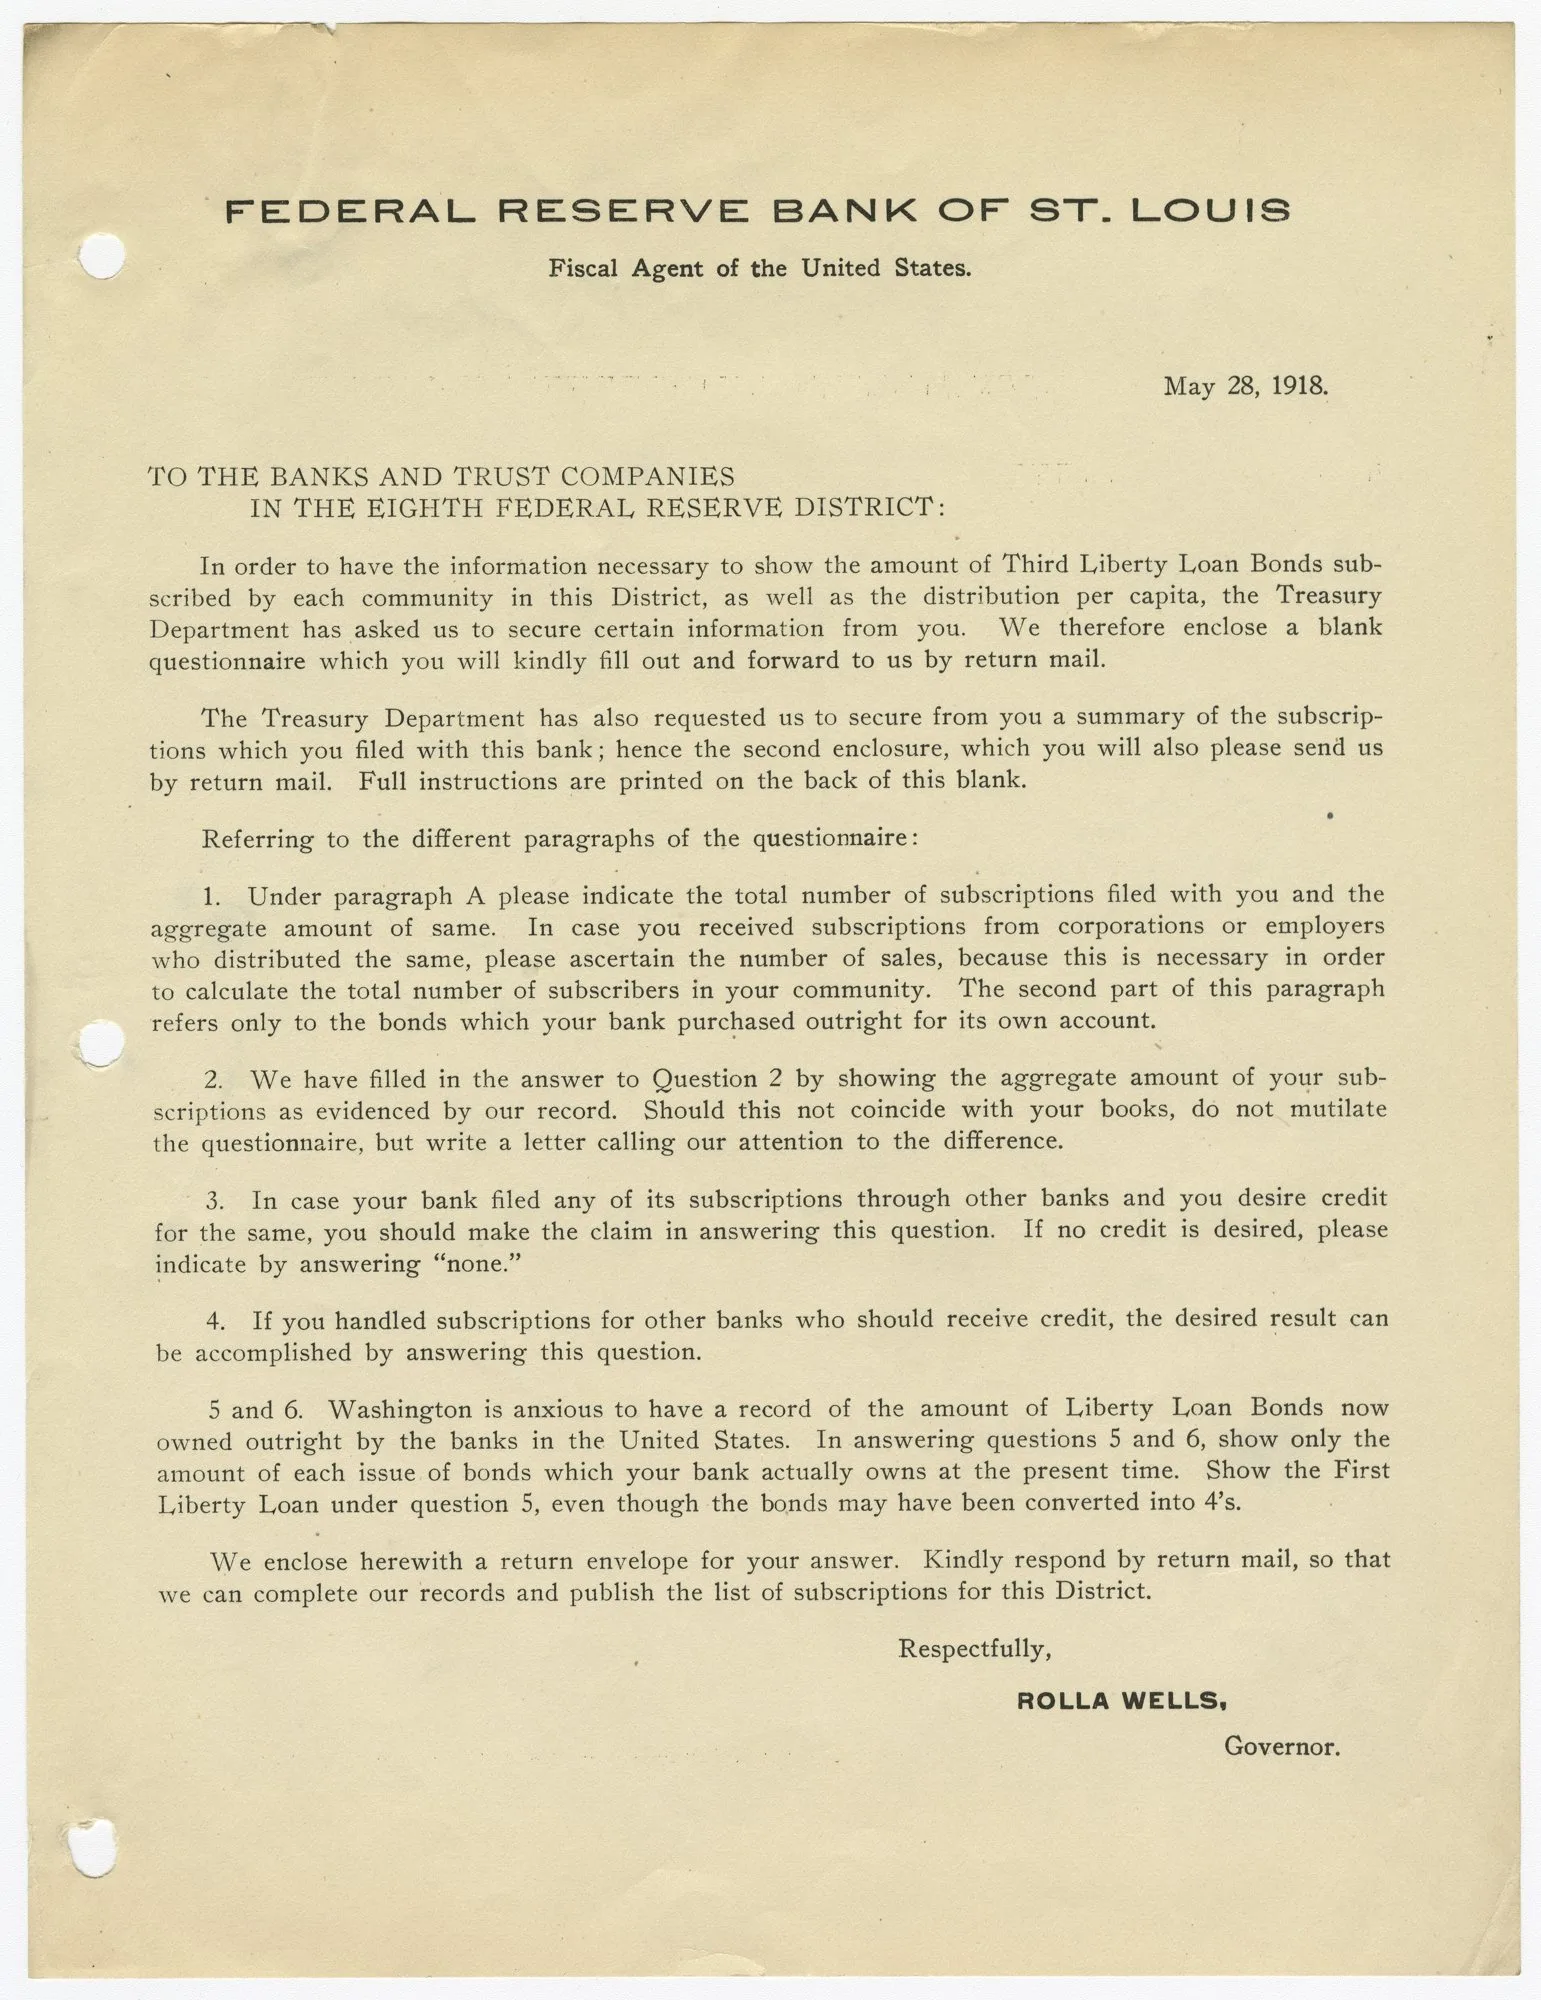
Data sourced from the Federal Reserve Bank of St. Louis (FRED). All rate data reflects the effective federal funds rate as reported monthly.
Comments?
React, share it, or leave a comment below.
Write your thoughts?
No comments yet. Start the conversation.
Existing comments couldn't be loaded right now. You can still post one.