Analyzing Financial Ratios Using the Finance Toolkit Ratios Module
A hands-on tour of the Finance Toolkit's Ratios Module in Python, using real output for Apple, Amazon, Meta, and Walmart to compare profitability, liquidity, efficiency, and valuation.
 Christopher A. Rotunno 8 min read

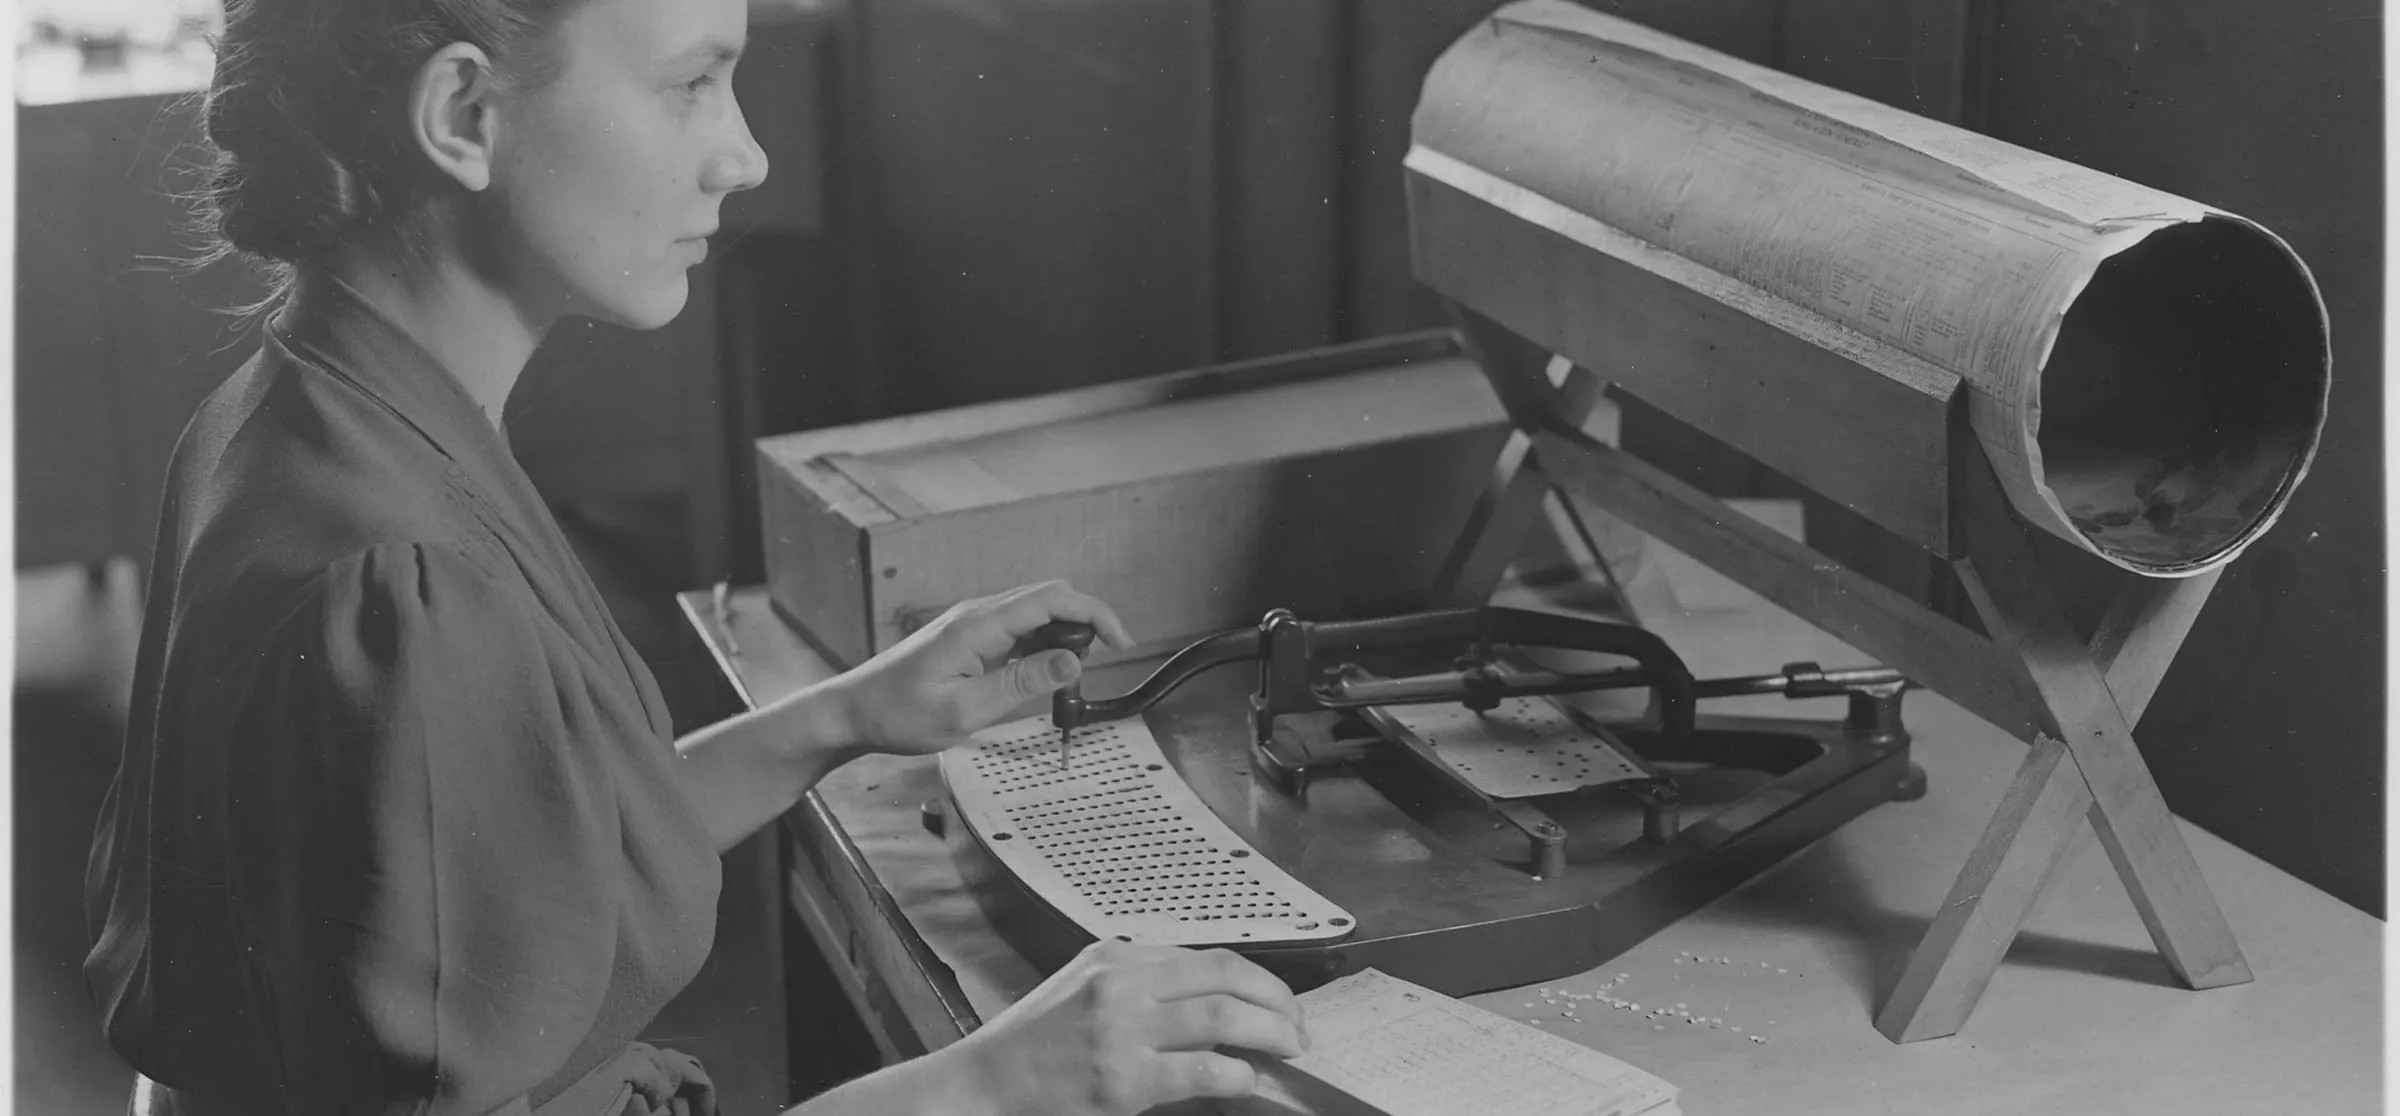
Photo: Carol M. Highsmith / Public domain / Wikimedia Commons
Financial ratios are how you compare companies that are nothing alike in size. Apple and Walmart both report hundreds of billions in revenue, but they make money in completely different ways, and the raw numbers hide that. Ratios put them on the same scale.
The Finance Toolkit is an open-source Python package that calculates more than 50 of them from a company’s financial statements, using transparent formulas you can check yourself. This post walks through its Ratios Module, using four companies: Apple (AAPL), Amazon (AMZN), Meta (META), and Walmart (WMT).
What the Ratios Module Covers
The module groups its ratios into five categories. Each one answers a different question about a business:
- Efficiency: how well the company turns its resources into revenue.
- Liquidity: whether it can pay the bills coming due in the next year.
- Profitability: how much of each dollar of revenue it keeps.
- Solvency: whether it can carry its debt over the long run.
- Valuation: what the market is paying for its earnings.
The full list is in the reference at the end of this post. Here are the patterns that stand out across the four companies:
- Walmart turns its assets over fastest. It generated more than $2.50 of sales for every dollar of assets in 2023, about double Apple and Amazon.
- Meta is the most liquid. It led on both the current ratio and the quick ratio every year, with a current ratio above 5 in 2020.
- Apple’s return on equity is extreme. Above 170% in 2022 and 2023, largely because years of buybacks have shrunk its shareholder equity.
- Amazon’s 2022 is an outlier everywhere. A net loss that year turned its ROA, ROE, and P/E negative.
Setting Up the Ratios Module
Install the package, then initialize the Toolkit with the tickers you want to compare. It pulls statements from Financial Modeling Prep, so you’ll need a free API key from them.
# Install the financetoolkit package using pip
pip install financetoolkit -U

# Import the Toolkit
from financetoolkit import Toolkit

# Set up API access to FMP
API_KEY = "FINANCIAL_MODELING_PREP_API_KEY"

# Initialize the Toolkit with company tickers
companies = Toolkit(
    ["AAPL", "AMZN", "META", "WMT"], api_key=API_KEY, start_date="2005-01-01"
)
Every ratio is then one method call away. The tables below show the Toolkit’s output for 2020 through 2024. Walmart’s fiscal year ends in January, so its numbers land a year later than the others, which is why only Walmart has a 2024 value.
Profitability
Return on Assets (ROA)
ROA measures how much profit a company earns from everything it owns.
ROA = Net Income / Average Total Assetsroa_ratios = companies.ratios.get_return_on_assets()
print(roa_ratios)| Company | 2020 | 2021 | 2022 | 2023 | 2024 |
|---|---|---|---|---|---|
| AAPL | 17.33% | 28.06% | 28.36% | 27.50% | |
| AMZN | 7.81% | 9.00% | -0.62% | 6.14% | |
| META | 19.92% | 24.21% | 13.19% | 18.83% | |
| WMT | 5.53% | 5.50% | 4.78% | 6.26% |
Apple held steady around 28% from 2021 on. Amazon dipped below zero in 2022, and Walmart’s low ROA is the flip side of a business built on thin margins and huge volume.
Return on Equity (ROE)
ROE measures the profit generated on the money shareholders have invested.
ROE = Net Income / Average Shareholders' Equityroe_ratios = companies.ratios.get_return_on_equity()
print(roe_ratios)| Company | 2020 | 2021 | 2022 | 2023 | 2024 |
|---|---|---|---|---|---|
| AAPL | 73.69% | 147.44% | 175.46% | 171.95% | |
| AMZN | 27.44% | 28.81% | -1.91% | 17.49% | |
| META | 25.42% | 31.10% | 18.52% | 28.04% | |
| WMT | 15.98% | 15.24% | 13.28% | 17.77% |
An ROE above 100% is a reminder to read a ratio alongside its inputs. Apple has spent hundreds of billions buying back its own stock, which shrinks shareholders’ equity. A smaller denominator pushes ROE up even when net income is flat.
Liquidity
Current Ratio
The current ratio compares what a company can turn into cash within a year to what it owes within a year. Above 1 means current assets cover current liabilities.
Current Ratio = Current Assets / Current Liabilitiescurrent_ratio = companies.ratios.get_current_ratio()
print(current_ratio)| Company | 2020 | 2021 | 2022 | 2023 | 2024 |
|---|---|---|---|---|---|
| AAPL | 1.36 | 1.07 | 0.88 | 0.99 | |
| AMZN | 1.05 | 1.14 | 0.94 | 1.05 | |
| META | 5.05 | 3.15 | 2.20 | 2.67 | |
| WMT | 0.79 | 0.97 | 0.93 | 0.82 | 0.83 |
Quick Ratio
The quick ratio, also called the acid-test ratio, is stricter. It drops inventory, which can take months to sell, and asks whether the most liquid assets alone cover short-term debts.
Quick Ratio = (Current Assets - Inventory) / Current Liabilitiesquick_ratio = companies.ratios.get_quick_ratio()
print(quick_ratio)| Company | 2020 | 2021 | 2022 | 2023 | 2024 |
|---|---|---|---|---|---|
| AAPL | 1.22 | 0.91 | 0.71 | 0.84 | |
| AMZN | 0.86 | 0.91 | 0.72 | 0.84 | |
| META | 4.89 | 2.94 | 2.01 | 2.55 | |
| WMT | 0.20 | 0.26 | 0.26 | 0.18 | 0.20 |
Meta leads on both measures by a wide margin: it carries a lot of cash and almost no inventory. Walmart is the opposite. Its quick ratio sits near 0.2 because so much of its current assets is merchandise on shelves. For a retailer that sells inventory as fast as Walmart does, that isn’t a warning sign the way it would be for a slower business.
Efficiency
Asset Turnover Ratio
Asset turnover measures how many dollars of sales a company generates for each dollar of assets.
Asset Turnover Ratio = Net Sales / Average Total Assetsasset_turnover = companies.ratios.get_asset_turnover_ratio()
print(asset_turnover)| Company | 2020 | 2021 | 2022 | 2023 | 2024 |
|---|---|---|---|---|---|
| AAPL | 0.83 | 1.08 | 1.12 | 1.09 | |
| AMZN | 1.41 | 1.27 | 1.16 | 1.16 | |
| META | 0.59 | 0.73 | 0.66 | 0.65 | |
| WMT | 2.29 | 2.30 | 2.50 | 2.61 |

Walmart’s turnover climbed every year, reaching 2.61 in 2024. Meta sits at the bottom for the opposite reason: its business runs on data centers and intangible assets that are expensive to build but don’t scale sales the way store shelves do.
Solvency
Debt-to-Equity Ratio
Debt-to-equity compares how much of a company is financed by borrowing versus by shareholders. Higher means more leverage, which amplifies both gains and losses.
Debt-to-Equity Ratio = Total Debt / Total Shareholders' Equitydebt_to_equity = companies.ratios.get_debt_to_equity_ratio()
print(debt_to_equity)Like ROE, this ratio is sensitive to buybacks. When a company retires shares, equity shrinks and debt-to-equity rises, even if it hasn’t borrowed a dollar more.
Valuation
Price-to-Earnings (P/E) Ratio
P/E is what investors pay for each dollar of a company’s earnings. A high P/E usually means the market expects strong growth.
P/E Ratio = Market Price per Share / Earnings per Sharepe_ratio = companies.ratios.get_price_earnings_ratio()
print(pe_ratio)| Company | 2020 | 2021 | 2022 | 2023 | 2024 |
|---|---|---|---|---|---|
| AAPL | 39.66 | 31.15 | 21.06 | 31.27 | |
| AMZN | 77.87 | 51.47 | -314.37 | 52.40 | |
| META | 26.99 | 24.35 | 13.97 | 23.73 | |
| WMT | 26.26 | 29.28 | 28.37 | 36.54 | 42.71 |
Amazon’s 2022 value of -314 isn’t a typo. When earnings are negative, P/E turns negative and stops being meaningful. That’s a good example of why a ratio needs context: on its own, it would look like a data error.
Ratio Reference
The Ratios Module includes far more than the ratios above. Here is the full set by category, with the formula behind each one.
Efficiency Ratios
| Ratio | Formula | What it shows |
|---|---|---|
| Asset Turnover | Net Sales / Average Total Assets | Sales generated per dollar of assets |
| Inventory Turnover | Cost of Goods Sold / Average Inventory | How often inventory is sold and replaced |
| Days of Inventory Outstanding | 365 / Inventory Turnover | Average days to sell inventory |
| Days of Sales Outstanding | (Accounts Receivable / Total Credit Sales) × 365 | Average collection period |
| Operating Cycle | DIO + DSO | Days from buying inventory to collecting cash |
| Accounts Payable Turnover | Total Purchases / Average Accounts Payable | How often suppliers are paid |
| Days of Accounts Payable Outstanding | 365 / Accounts Payable Turnover | Average days to pay suppliers |
| Cash Conversion Cycle | DIO + DSO - DPO | Days to turn inputs into cash |
| Cash Conversion Efficiency | (Operating Cash Flow / Net Sales) × 100 | How much income becomes cash |
| Receivables Turnover | Net Credit Sales / Average Accounts Receivable | How well credit is collected |
| SG&A to Revenue | (SG&A Expenses / Revenue) × 100 | Overhead as a share of revenue |
| Fixed Asset Turnover | Net Sales / Average Fixed Assets | Sales per dollar of fixed assets |
| Operating Ratio | (Operating Expenses / Net Sales) × 100 | Operating efficiency |
Liquidity Ratios
| Ratio | Formula | What it shows |
|---|---|---|
| Current Ratio | Current Assets / Current Liabilities | Ability to pay short-term obligations |
| Quick Ratio | (Current Assets - Inventory) / Current Liabilities | Ability to pay without selling inventory |
| Cash Ratio | Cash and Equivalents / Current Liabilities | The most conservative liquidity test |
| Working Capital | Current Assets - Current Liabilities | Funds available for operations |
| Operating Cash Flow Ratio | Operating Cash Flow / Current Liabilities | Short-term coverage from operations |
| Operating Cash Flow Sales Ratio | Operating Cash Flow / Sales | Cash generated per dollar of sales |
| Short-Term Coverage Ratio | Operating Cash Flow / Short-Term Debt | Ability to service short-term debt |
Profitability Ratios
| Ratio | Formula | What it shows |
|---|---|---|
| Gross Margin | ((Revenue - COGS) / Revenue) × 100 | Profit after direct production costs |
| Operating Margin | (Operating Income / Revenue) × 100 | Profit from core operations |
| Net Profit Margin | (Net Income / Revenue) × 100 | Profit after all expenses |
| Interest Burden Ratio | Earnings Before Tax / EBIT | How much interest eats into profit |
| Income Before Tax Profit Margin | (Earnings Before Tax / Revenue) × 100 | Profitability before taxes |
| Effective Tax Rate | (Income Tax Expense / Earnings Before Tax) × 100 | Actual tax burden |
| Return on Assets | Net Income / Average Total Assets | Profit from everything the company owns |
| Return on Equity | Net Income / Average Shareholders’ Equity | Profit on shareholder investment |
| Return on Invested Capital | NOPAT / Invested Capital | Return on all capital invested |
| Income Quality Ratio | Operating Cash Flow / Net Income | How much reported profit is backed by cash |
| Return on Tangible Assets | Net Income / (Total Assets - Intangible Assets) | Return on physical assets |
| Return on Capital Employed | EBIT / Capital Employed | Profit relative to capital employed |
| Net Income per EBT | Net Income / Earnings Before Tax | Share of pre-tax income kept |
| Free Cash Flow to Operating Cash Flow | Free Cash Flow / Operating Cash Flow | Cash left after capital spending |
| Tax Burden Ratio | Net Income / EBT | Tax impact on profit |
| EBT to EBIT | EBT / EBIT | Impact of interest on earnings |
| EBIT to Revenue | (EBIT / Revenue) × 100 | Operating profit margin |
Solvency Ratios
| Ratio | Formula | What it shows |
|---|---|---|
| Debt to Assets | Total Debt / Total Assets | Share of assets financed by debt |
| Debt to Equity | Total Debt / Total Shareholders’ Equity | Balance of debt and equity financing |
| Interest Coverage | EBIT / Interest Expense | Ability to pay interest |
| Equity Multiplier | Total Assets / Total Shareholders’ Equity | Leverage on shareholder equity |
| Debt Service Coverage | Operating Income / Total Debt Service | Ability to service all debt |
| Free Cash Flow Yield | (Free Cash Flow / Market Capitalization) × 100 | Cash flow relative to market value |
| Net Debt to EBITDA | Net Debt / EBITDA | Debt relative to earnings |
| Cash Flow Coverage | Operating Cash Flow / Total Debt | Cash flow relative to debt |
| CAPEX Coverage | Operating Cash Flow / Capital Expenditures | Ability to fund capital spending |
| CAPEX Dividend Coverage | Operating Cash Flow / (CAPEX + Dividends) | Ability to fund capital spending and dividends |
Valuation Ratios
| Ratio | Formula | What it shows |
|---|---|---|
| Earnings per Share | (Net Income - Preferred Dividends) / Weighted Average Shares | Profit per share |
| Revenue per Share | Revenue / Average Shares Outstanding | Revenue per share |
| Price to Earnings | Market Price per Share / EPS | Price paid per dollar of earnings |
Takeaways
- One method call per ratio. Once the Toolkit is initialized, comparing companies on any of 50+ ratios takes a single line.
- Ratios only make sense against peers and against time. Walmart’s quick ratio of 0.2 looks alarming alone and ordinary for a big-box retailer.
- Read the inputs, not just the output. Apple’s ROE above 170% and Amazon’s P/E of -314 are both correct, and both would mislead anyone who didn’t check what drove them.
From here, try the Toolkit on companies you follow, and pair the numbers with what ratios can’t capture: competitive position, market trends, and where growth will come from. The Finance Toolkit documentation covers every ratio in detail.
Comments?
React, share it, or leave a comment below.
Write your thoughts?
No comments yet. Start the conversation.
Existing comments couldn't be loaded right now. You can still post one.