Titanic: Machine Learning from Disaster
The Titanic dataset is the classic ML classification benchmark. Here's a full walkthrough — feature engineering, Random Forest, Logistic Regression, and what the results actually mean.
 Christopher A. Rotunno 2 min read
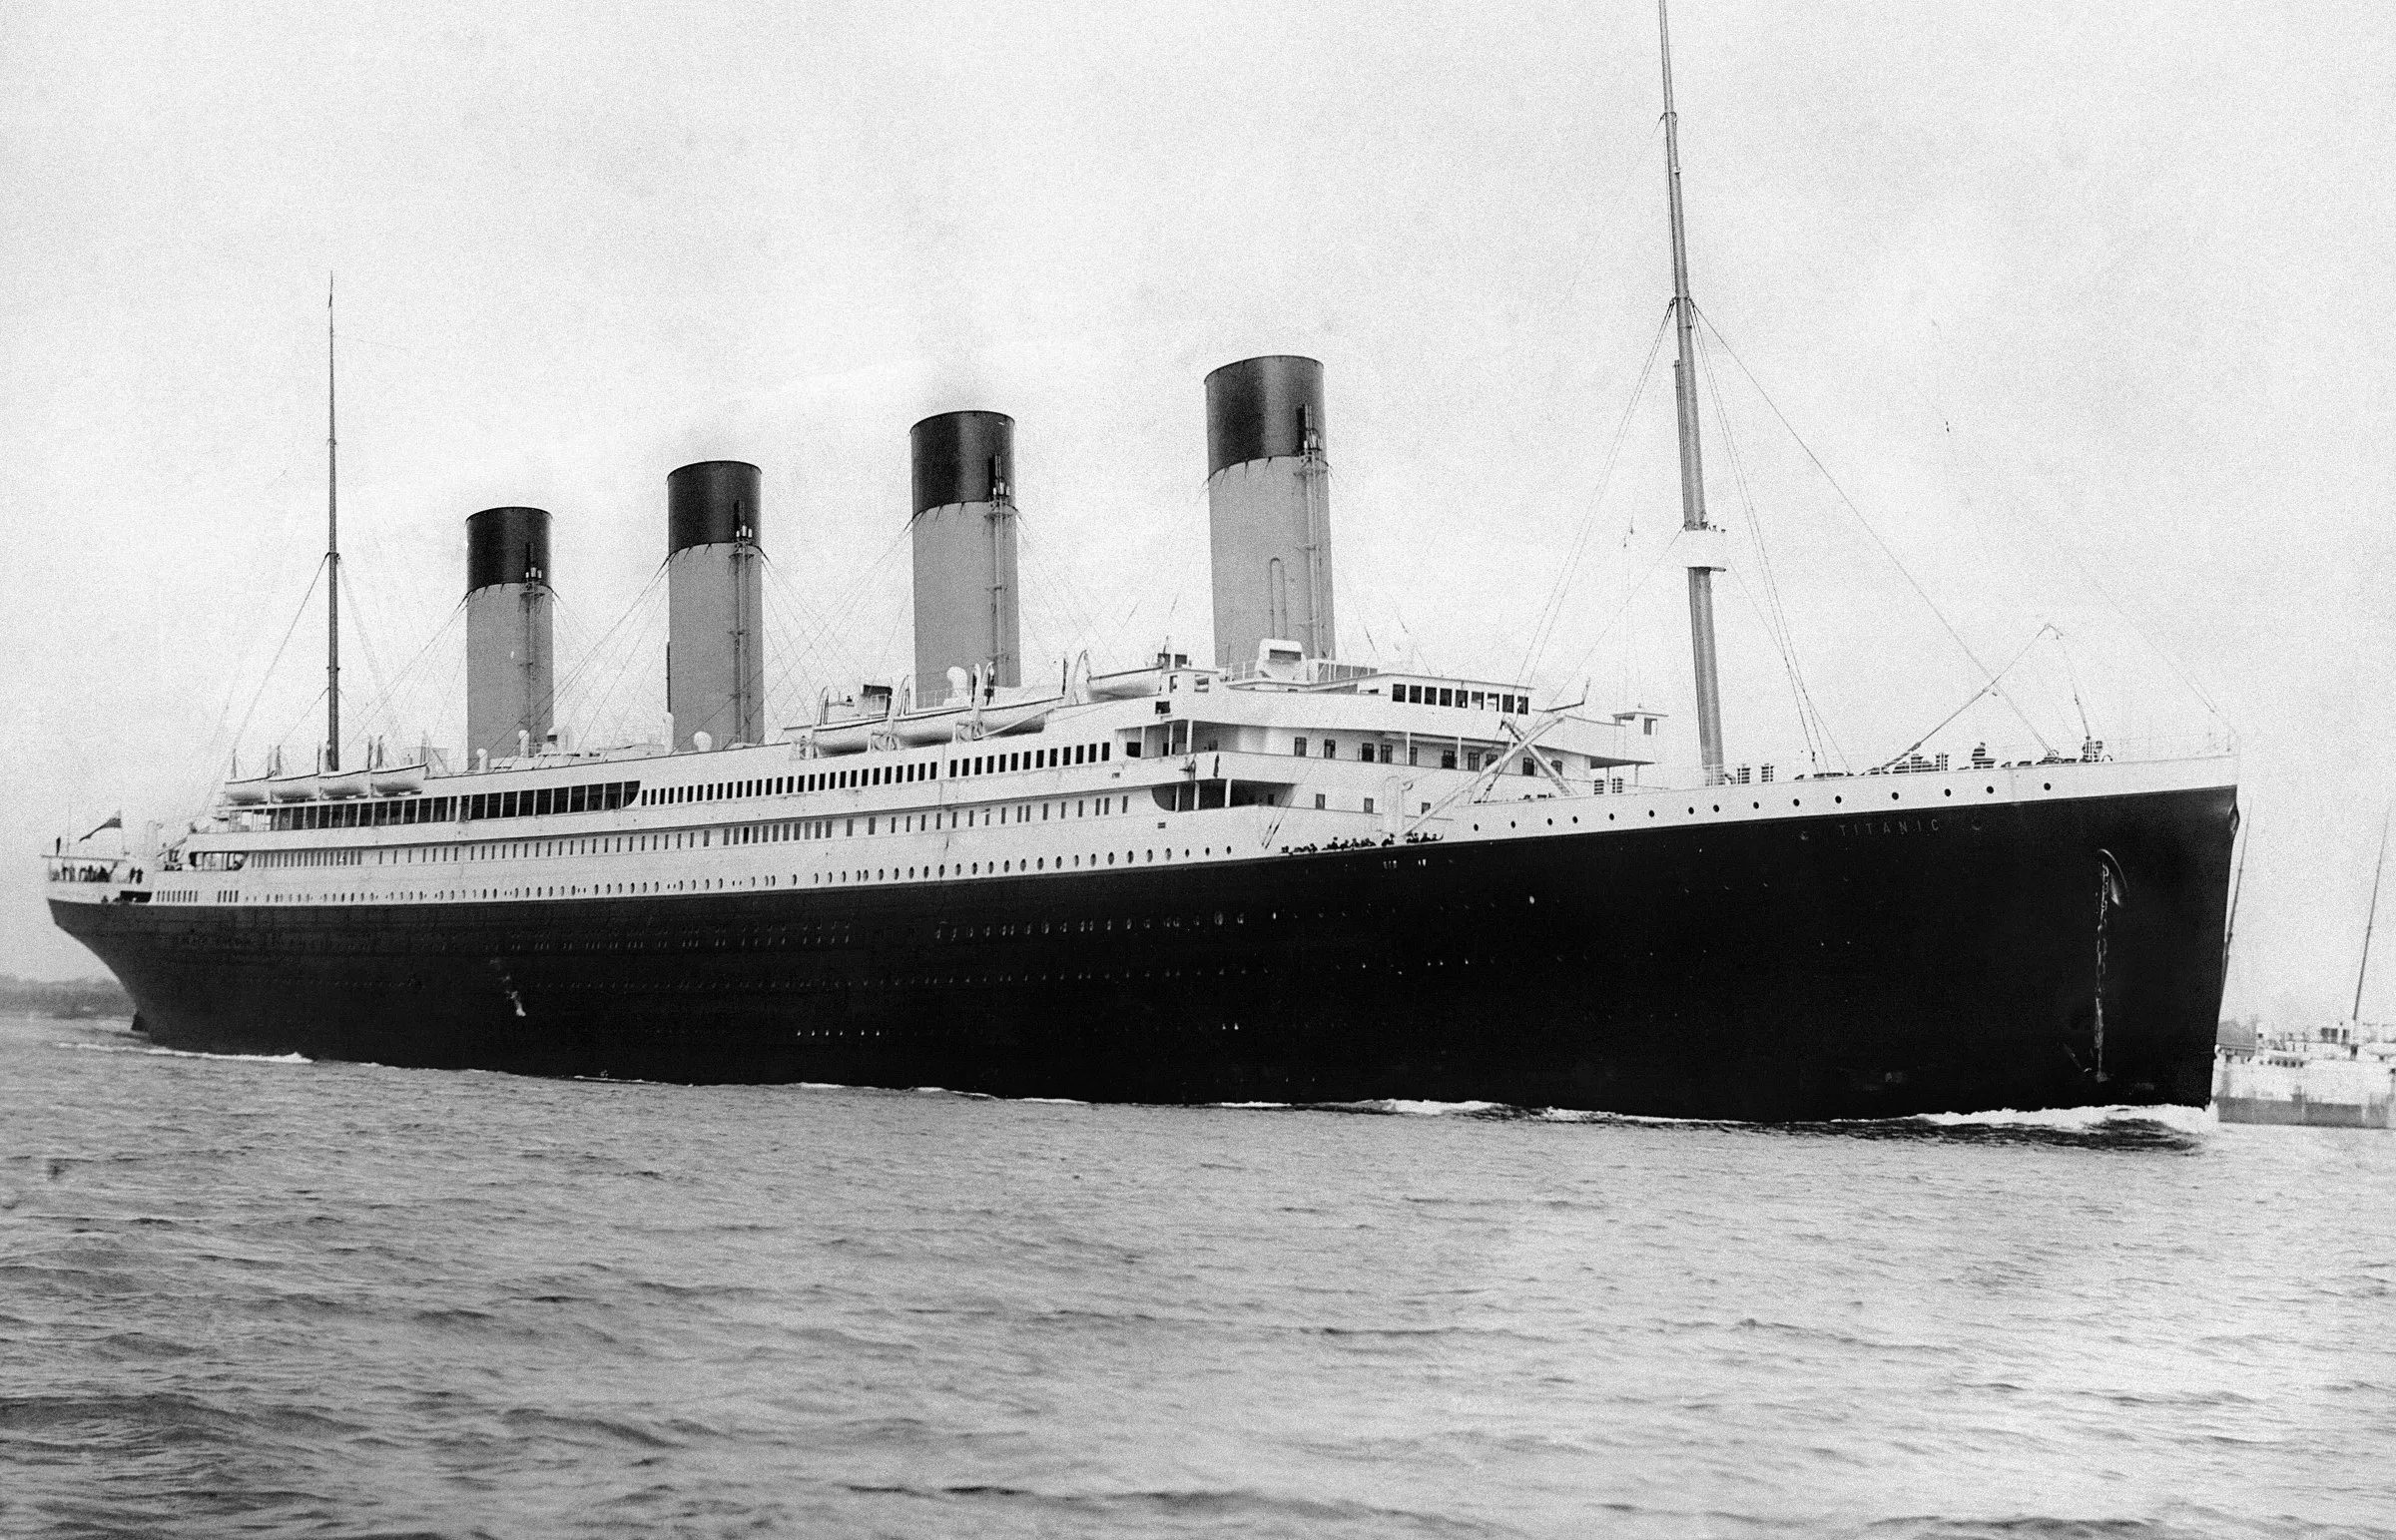
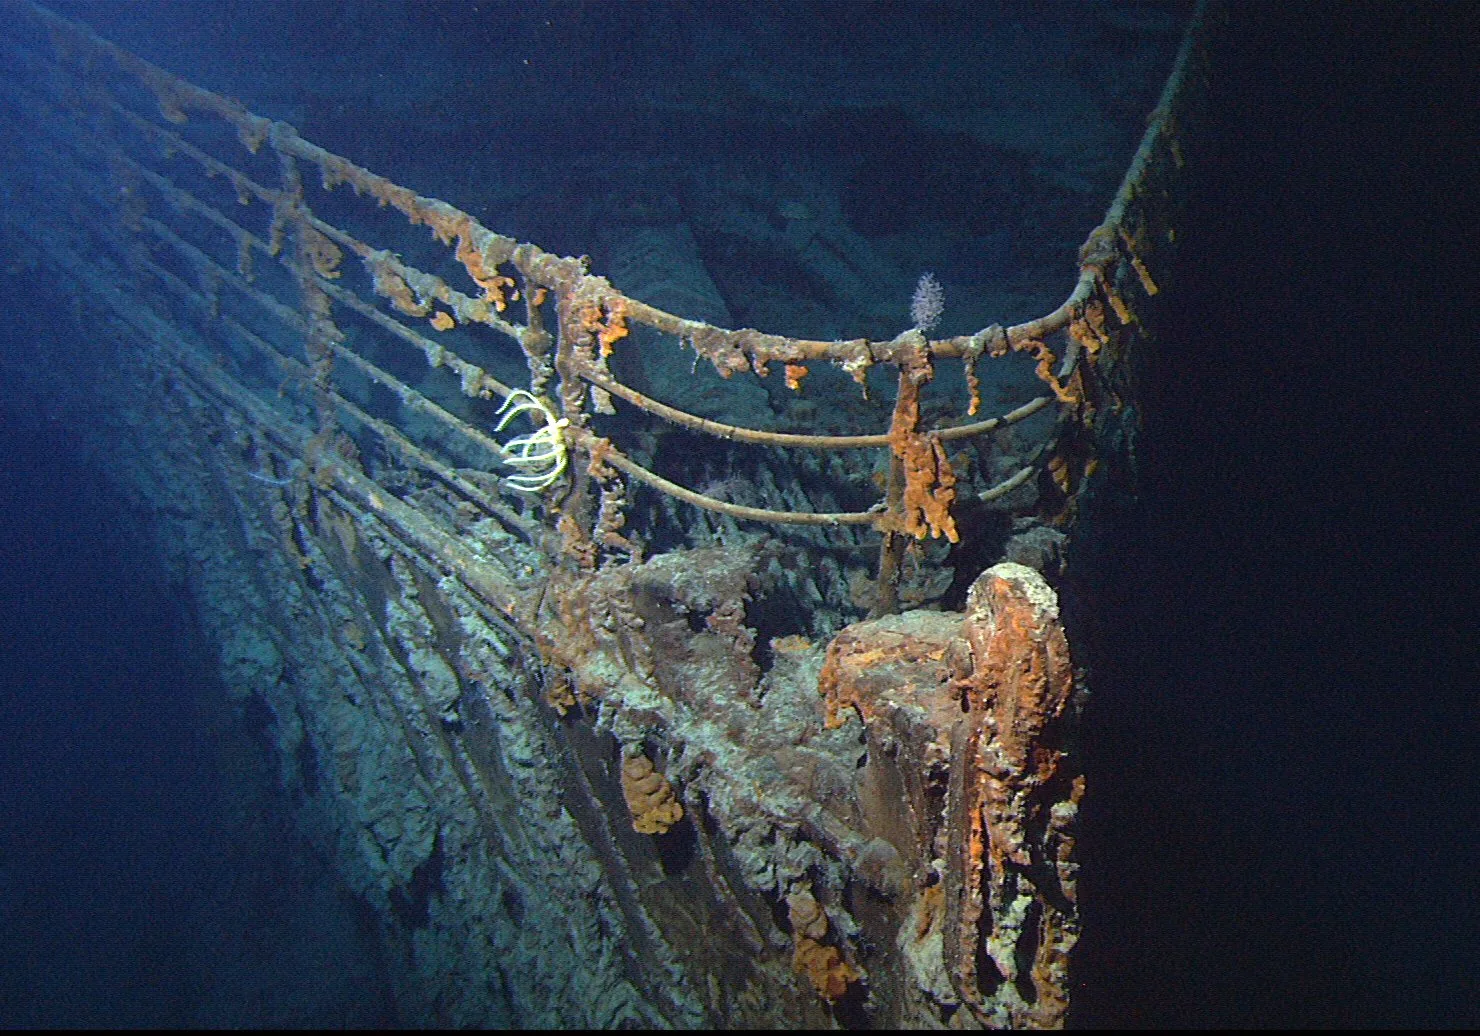
Photo: Francis Godolphin Osbourne Stuart / Public domain / Wikimedia Commons
The Titanic dataset is one of the most widely used introductory benchmarks in data science. Its value is not that predicting survival in the 1912 shipwreck is professionally useful, but that the problem has the right amount of complexity for learning: missing values, categorical features, a clear binary target, and enough data to train real models.
This is a full walkthrough from raw data to submission-ready predictions.
The Dataset
The training set has 891 passengers. The test set has 417. Each passenger record includes:
| Variable | Description |
|---|---|
Survived | Target: 0 = No, 1 = Yes |
Pclass | Passenger class (1 = 1st, 2 = 2nd, 3 = 3rd) |
Name | Passenger name |
Sex | male / female |
Age | Age in years (missing for ~20%) |
SibSp | # of siblings/spouses aboard |
Parch | # of parents/children aboard |
Ticket | Ticket number |
Fare | Passenger fare |
Cabin | Cabin number (mostly missing) |
Embarked | Port of embarkation: C, Q, or S |
Step 1: Load and Inspect
import pandas as pd
import numpy as np
from sklearn.ensemble import RandomForestClassifier
from sklearn.linear_model import LogisticRegression
from sklearn.metrics import accuracy_score
import matplotlib.pyplot as plt

# Load from Kaggle's public GitHub mirror
train_url = "https://raw.githubusercontent.com/datasciencedojo/datasets/master/titanic.csv"
df = pd.read_csv(train_url)

print(df.shape)
print(df.isnull().sum())
You’ll see Age missing for ~177 rows, Cabin missing for ~687, and Embarked missing for just 2. That tells you which fields require attention.
Step 2: Feature Engineering
Encode Categorical Variables
df = pd.get_dummies(df, columns=['Sex', 'Embarked'], drop_first=True)Extract Titles from Names
Passenger names contain titles (Mr, Mrs, Miss, Master, Dr, etc.) that encode gender, age, and social status — all predictive of survival outcomes:
df['Title'] = df['Name'].str.extract(r' ([A-Za-z]+)\.', expand=False)
df['Title'] = df['Title'].replace(
    ['Lady','Countess','Capt','Col','Don','Dr','Major','Rev','Sir','Jonkheer','Dona'],
    'Rare'
)
df['Title'] = df['Title'].replace({'Mlle': 'Miss', 'Ms': 'Miss', 'Mme': 'Mrs'})
df['Title'] = pd.Categorical(df['Title']).codes
Bin Ages into Decade Groups
df['AgeBand'] = pd.cut(df['Age'].fillna(df['Age'].median()), bins=8, labels=False)This reduces the noise from exact ages while preserving the signal that children had meaningfully better survival rates.
Step 3: Prepare Features
features = ['Pclass', 'Age', 'SibSp', 'Parch', 'Fare',
            'Sex_male', 'Embarked_Q', 'Embarked_S', 'Title', 'AgeBand']

# Fill remaining nulls
df[features] = df[features].fillna(df[features].median())

X = df[features]
y = df['Survived']
Step 4: Train a Random Forest
from sklearn.model_selection import train_test_split

X_train, X_val, y_train, y_val = train_test_split(
    X, y, test_size=0.2, random_state=42
)

rf = RandomForestClassifier(n_estimators=100, max_depth=5, random_state=42)
rf.fit(X_train, y_train)

print(f"Validation accuracy: {accuracy_score(y_val, rf.predict(X_val)):.4f}")
Step 5: Feature Importance
importances = pd.Series(rf.feature_importances_, index=features).sort_values(ascending=False)

importances.plot(kind='barh', figsize=(8, 5))
plt.title("Feature Importances — Random Forest")
plt.tight_layout()
plt.show()
Typically Sex_male, Fare, and Title dominate — reflecting the “women and children first” evacuation pattern and the reality that first-class passengers had better access to lifeboats.
Step 6: Logistic Regression Baseline
lr = LogisticRegression(max_iter=1000, random_state=42)
lr.fit(X_train, y_train)

print(f"Logistic Regression accuracy: {accuracy_score(y_val, lr.predict(X_val)):.4f}")
Logistic Regression typically achieves 78–82% accuracy on this dataset — comparable to Random Forest and much easier to explain to stakeholders. The coefficients directly tell you which features push the survival probability up or down.
What the Results Tell Us

The model confirms what historical records suggest:
- Sex was the dominant factor. Women survived at roughly 74% vs. 19% for men.
- Class mattered. First-class survival rate was ~63%; third-class was ~24%.
- Traveling alone was a disadvantage. Passengers with family aboard had slightly better survival rates.
- Fare correlates with survival — not directly, but because it proxies for cabin location and passenger class.
Why This Problem Still Matters
The Titanic dataset teaches the skills that transfer everywhere:
- Handling missing data without introducing leakage
- Engineering features that carry real signal
- Comparing model complexity vs. interpretability tradeoffs
- Validating that your model captures real patterns, not noise
The workflow — load, clean, engineer, model, evaluate — is the same whether you’re predicting shipwreck survival or customer churn. Get comfortable with the pattern here, then apply it to problems that actually affect someone’s bottom line.
Comments?
React, share it, or leave a comment below.
Write your thoughts?
No comments yet. Start the conversation.
Existing comments couldn't be loaded right now. You can still post one.