Predicting Patterns
How Predicting Patterns, Sequence, and Time Shapes My Work
Markets, customers, storms, and songs all move in patterns. The skill is seeing the next beat before it lands, then designing dashboards, pages, and conversations around it.

- Watching 24/7 financial market data for anomalies
- 3+ yrs
- Watching 24/7 financial market data for anomalies
- AE Global Solutions
- Business Analytics: predictive modeling, ML, and NLP
- M.S.
- Business Analytics: predictive modeling, ML, and NLP
- CU Boulder Leeds, 2023
- Customers served, each one a pattern worth reading
- 100K+
- Customers served, each one a pattern worth reading
- Career total
- Top performance designation for converting conversations
- S-Tier
- Top performance designation for converting conversations
- Renuity Home
Pattern recognition
- Anticipates the next question before it gets asked
- Trained in predictive and prescriptive analytics
- Reads markets, data, and people in real time
A murmuration of starlings looks like one creature thinking. It isn’t. Researchers who filmed these flocks in 3D found that each bird tracks only its six or seven nearest neighbors, and that simple local rule is what lets thousands of birds turn as one.1
Organizations, markets, and customers work the same way. Big shifts are built from small, readable signals. The same instinct for what comes next shows up across everything I do, on its own terms in each place.
Nature Runs on Patterns

A sunflower doesn’t plan its spirals. Each new seed grows at nearly the same angle from the last, and the pattern emerges on its own.2
Data behaves like this too. A single transaction tells you almost nothing. A few million of them, lined up in sequence and time, start telling you what happens next. My M.S. in Business Analytics from CU Boulder’s Leeds School of Business trained that instinct formally: statistical methods, decision science, predictive and prescriptive analytics, machine learning, NLP, and deep learning. The math gives the instinct discipline.
Forecasts Earn Trust by Getting Better
Anyone who lives in Florida learns to respect a forecast cone.

In 1990, if the National Hurricane Center forecast a landfall near Tampa three days out, the average error stretched from Alabama to northern Cuba. By 2023, the same forecast’s average error had shrunk to roughly Cedar Key to Sanibel Island, and 2024 set records for track accuracy.3
That improvement didn’t come from one brilliant guess. It came from measuring every forecast against what actually happened and feeding the misses back in. That is how I treat any predictive work: a prediction you don’t score is just an opinion.
Markets Move in Rhythms
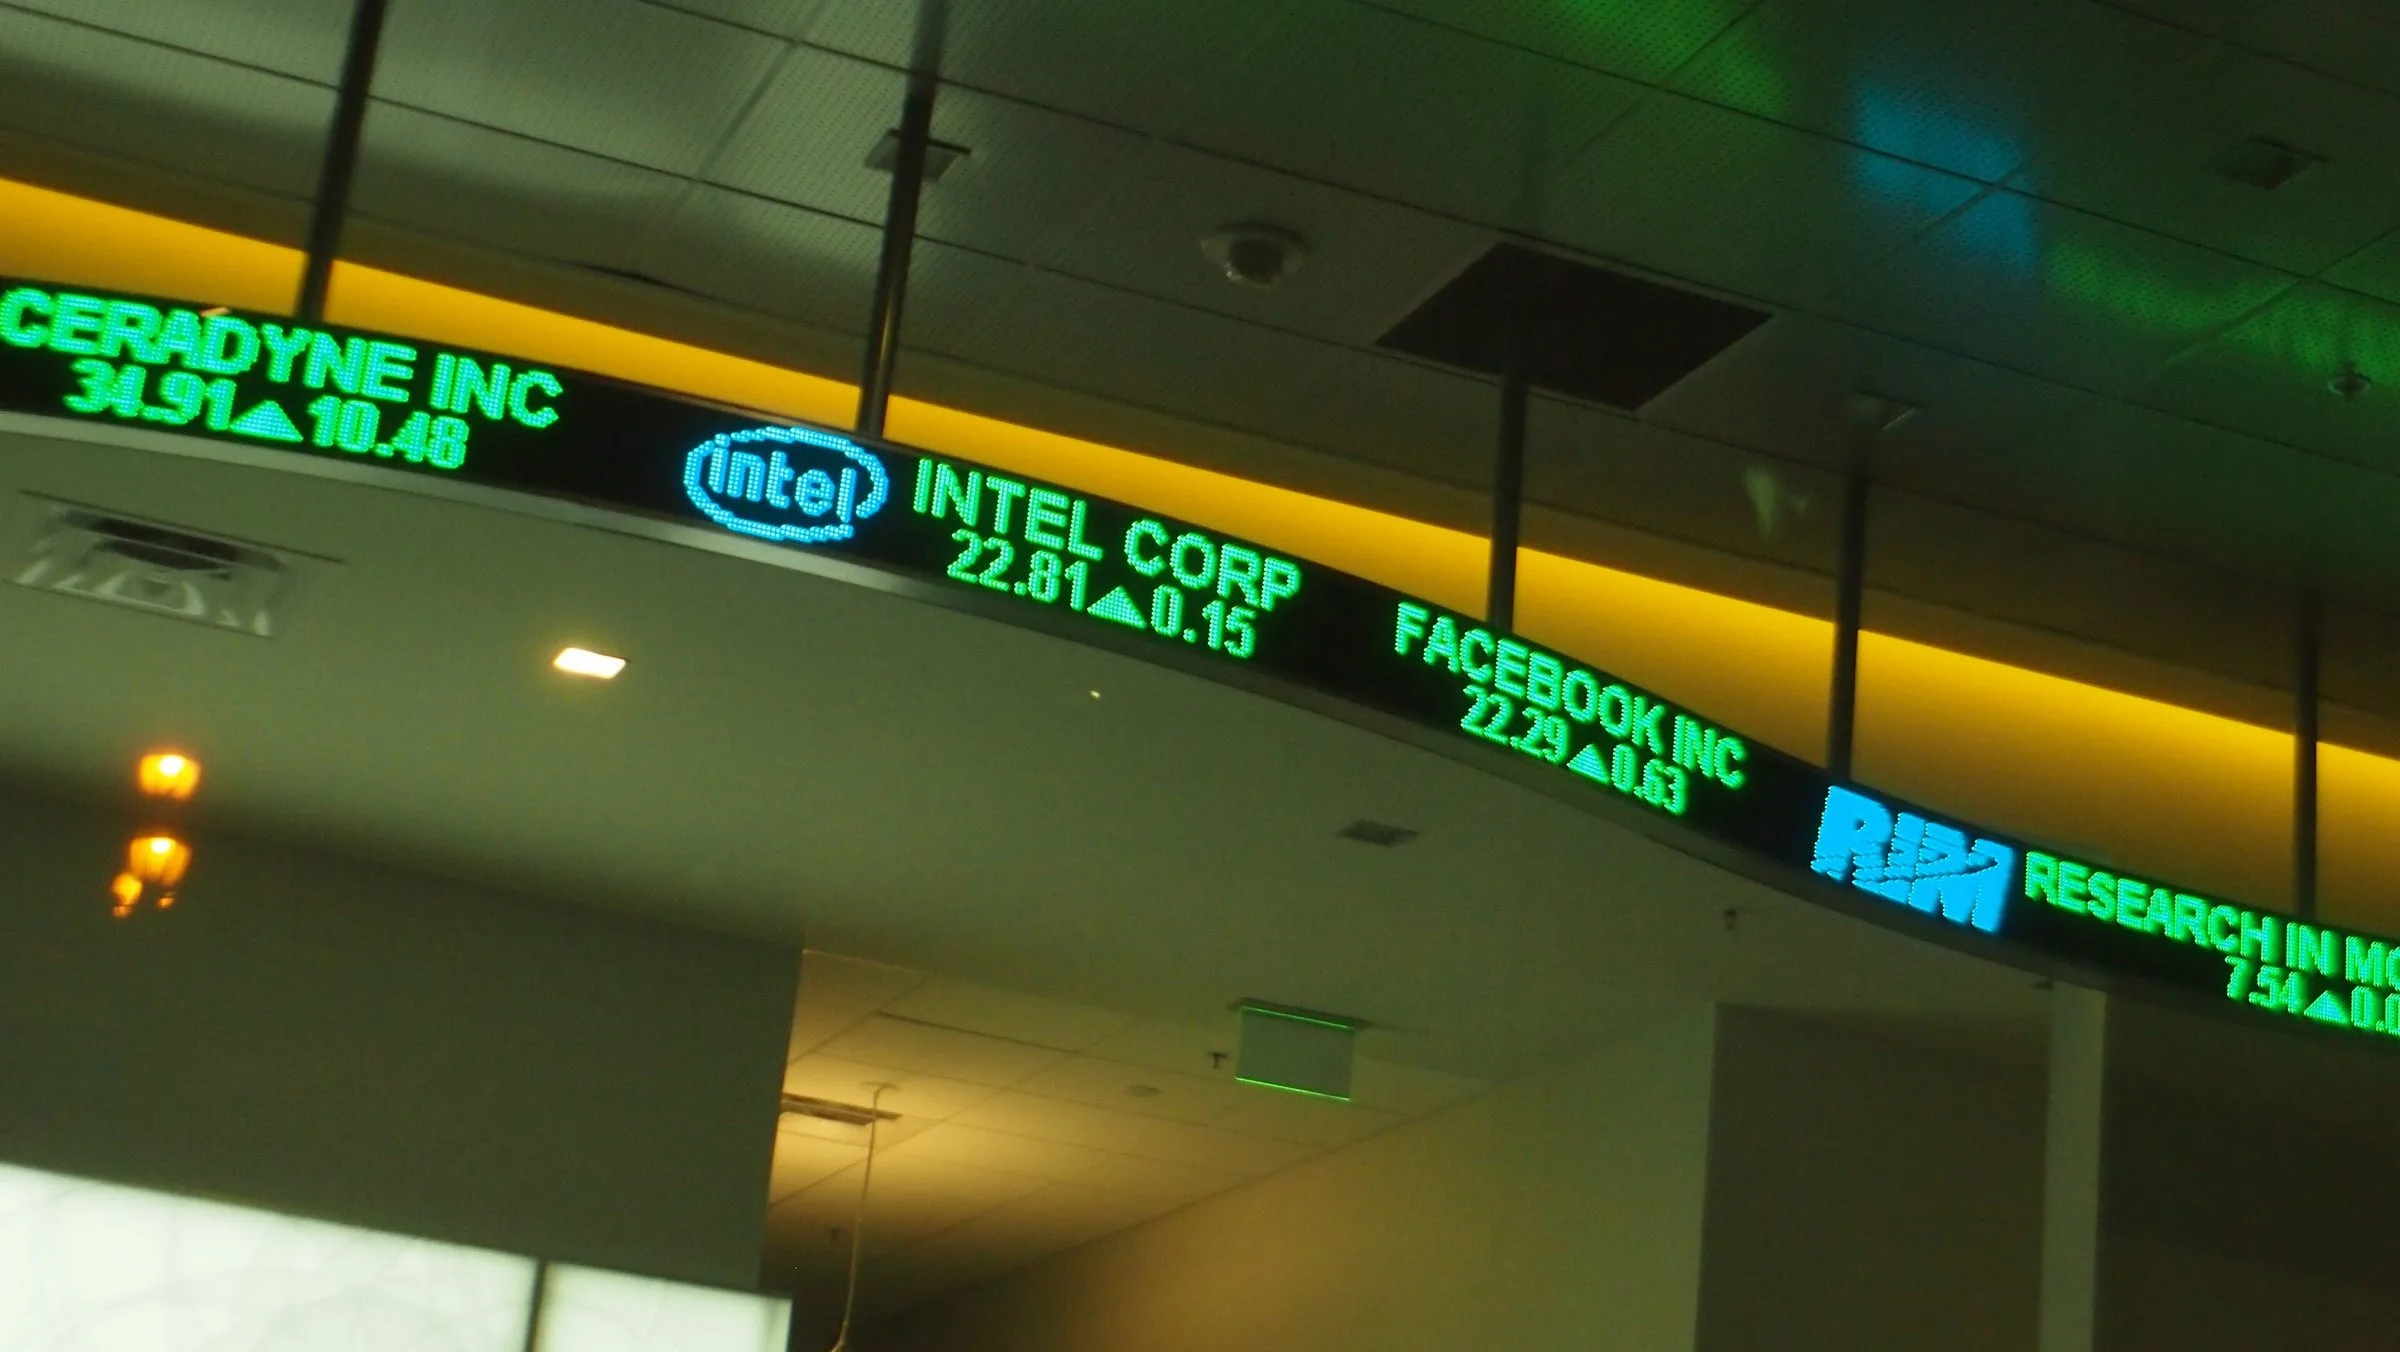
For more than three years at AE Global Solutions, I worked inside 24/7 financial market data, processing and validating 200GB+ a day. You learn the rhythms: how volume shifts through the trading day, and what normal looks like hour by hour. Once you know normal, abnormal jumps off the screen.
That is the core of anomaly detection, and it is why the platform caught problems before clients ever saw them.
Dashboards That Answer the Next Question
A good dashboard anticipates what someone needs to see before they have to ask for it. I design them in the order people think: the headline number first, then what changed, then why, then what to do about it.
Hans Rosling showed how powerful that sequencing can be. In four minutes, he turned 200 years of health and wealth data for 200 countries into a story anyone can follow, because each frame sets up the next.
Pages That Read the Way People Think
The same instinct shapes how I build for the web, including this site. Each section sets up what a visitor expects to find next: who I am, what I’ve done, proof that it worked, then how to reach me. When the sequence matches the reader’s own questions, the page feels effortless, even though every transition was planned.
Reading People in Real Time
Customers are patterns too. Across a career serving 100K+ customers, you learn to hear where a conversation is heading: the pause before an objection, the question that means someone is already sold, the detail that matters more than the price.
In home improvement sales at Renuity Home, that read helped me earn S-Tier, the company’s highest internal performance designation, converting homeowner conversations into scheduled in-home consultations at a rate that ranked among the top performers in the region.
Learning to Hear What Comes Next

During COVID, I picked up guitar from zero. The breakthrough wasn’t my fingers. It was my ear: learning to hear where a progression was going before I could play it.
That is the whole skill in miniature. Whether it is a chord change, a market open, or a customer’s next question, the work is the same. Learn the pattern well enough to hear the next beat, then be ready when it lands.
What You Get on Day One
- Dashboards that answer the next question before anyone has to ask it.
- Formal training in predictive analytics, paired with years of reading live market data.
- Forecasts that get scored, so predictions improve instead of just piling up.
- A real-time read on people, proven in front of customers, not just in a model.
Sources
- M. Ballerini et al., “Interaction ruling animal collective behavior depends on topological rather than metric distance: Evidence from a field study”, Proceedings of the National Academy of Sciences 105(4), 2008.
- “Fibonacci sequence: Nature”, Wikipedia.
- “National Hurricane Center says 2024 forecast tracks broke records for accuracy”, Scripps News, February 24, 2025.
- Hans Rosling, “200 Countries, 200 Years, 4 Minutes”, The Joy of Stats, BBC.
In practice
Projects where this shows up
Financial Market Data Platform
High-availability financial data infrastructure processing 200GB+ daily across 24/7 operations — 99% uptime, 99% accuracy, scaled through S&P and Reuters data partnerships.
Custom API Ingestion Pipeline
Cut third-party financial data costs by 80% by replacing a vendor dependency with a purpose-built Python ingestion layer — designed, built, and shipped with a team of four.
Analytics Community Program
Built a regional data and analytics community from scratch — 10+ events, 100+ attendees, and a network that became a talent pipeline and professional amplifier.
Core Capabilities
The other pillars
Want this on your team?
Thirty minutes is enough to see whether what I bring fits what you need.